
Once an airplane's drag polar is in hand, and in combination with a few, basic aircraft parameters, there are a wide range of aircraft performance calculations which become possible. For example, we could consider the relationship for an airplane's maximum sustained load factor, or g-load.

There is also a dependency on the angle of attack in this relationship. Note that for a small angle of attack, that the cosine value will tend to approach unity, and the sine value will approach zero. For many civilian aircraft applications, this approximation will be invoked.
Also visible in this relationship is a dependency on the zero-lift drag coefficient. However, the zero-lift drag coefficient is divided in this relationship by the wing loading squared. The airplane's sustained load factor will therefore be only weakly influenced by the drag coefficient, but will be heavily influenced by the thrust-to-weight ratio or wing loading.
The airplane's aspect ratio and aerodynamic, or Oswald's efficiency will also play a role in the calculation of the sustained load factor - sharing equal weight with both the thrust-to-weight ratio and the wing loading.
Once the load factor has been calculated, the associated turn rate rate can be directly determined, and will be directly proportional to the load factor.

We will find that these same aircraft parameters will appear over and over again in different performance calculations. What will differ will be the relative weight and influence that each parameter will have in the outcome of the calculation. Consider for example the maximum instantaneous load factor.

If we turn to the calculation of specific excess power, on the other hand, we will see that - like most measures of acceleration - specific excess power will be primarily a function of the thrust-to-weight ratio.
If we rearrange the relationship for specific excess power in terms of the load factor, we gain a relationship that will relate the load factor (and the turn rate) to the available specific excess power state. This relationship is crucial to calculting the energy state throughout an airplane's flight envelope, as will be discussed in a later segment.

For the purposes of many high-level, first-order comparisons between different aircraft designs, it is common to draw a comparison on the basis of wing loading, and thrust-to-weight ratio, in a manner reminiscent of the constraint diagram described earlier. This sort of plot is useful of describing basic trends.

In general, lower wing loadings will result in superior instantaneous turn rates. Similarly, higher thrust-to-weight ratios will result in superior acceleration. While useful for first-order comparisons, it should also be kept in mind that what is missing from this simplified comparison, is the effect of aerodynamic efficiency, which has been omitted from this type of plot.
If we draw a plot such as this for a number of fighter aircraft, we can begin to draw some basic comparisons for global trends. In order to keep this comparison grounded, all of the aircraft have been assessed with a similar fuel state and weapons load - with fifty percent of internal fuel and up to two air-to-air missiles. A rough adjustment has also been made to the thrust-to-weight ratio to account for the effects of thrust lapse at speed and altitude.
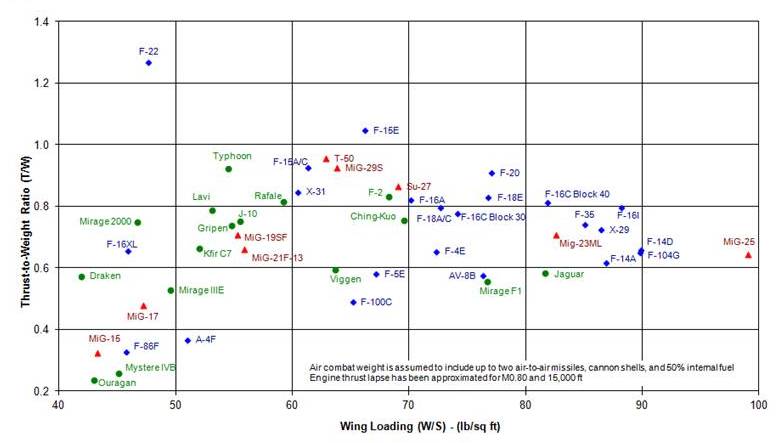
In this comparison, we can see a number of historical match-ups, such as between the MiG-15 and F-86 Sabre of the Korean War era. Obviously, the MiG had considerable, theoretical advantage over the F-86 in a classic, turning engagement. In practice, however, as many of us are aware, the Sabre crews had a number of advantages in their favor: foremost of which was their higher level of training, but also in terms of their control system - which will be discussed in a later segment.
We can also see in this plot a comparison between the MiG-21 and F-4 Phantom of the Vietnam War era, reaffirming what many of us were already aware of, in terms of the advantages of the MiG in a turning engagement.
Also from this plot, we can see how a particular aircraft model might evolve over the course of its lifetime. Consider for example the evolution of the F-16 from its F-16A Block 10 origins, to the F-16C Block 30, and later the Block 40, and eventually the Block 52+ F-16I. As more range and more payload was demanded of the airframe, weight was added. In this instance, additional thrust was also added throughout the life of the program, but the addition of this thrust could not alter the increase in wing loading that came with each successive generation. The one exception to reverse this trend was Japan's F-2 derivative from the F-16, which added additional wing area to achieve a wing loading similar to the early F-16A despite its greater weight and payload capacity.
Another match-up that we can witness from a comparison such as this comes from the Eurofighter Typhoon. When the Typhoon was under development, a series of studies were published in Europe evaluating just how much thrust-to-weight ratio the European partners could afford in practice, and still be able to produce enough aircraft to be meaningful. The Typhoon was the product of those studies. On the other side of the Atlantic, however, the United States, with much deeper pockets, produced the F-22 Raptor, which far exceeded the thrust-to-weight limits that had been set on the Typhoon due to economic realities. Both the Typhoon and the Raptor were heavily biased towards the air-to-air role, and both are excellent platforms in their intended role. In this example, however, the power of economics can be clearly seen.
While useful for initial comparisons, it should not be forgotten, however, that a third component - the aerodynamic component - is nonetheless missing from these basic comparisons.
No comments:
Post a Comment