Showing posts with label Performance. Show all posts

Sunday, May 15, 2016

Lavi - An Engineer's Perspective - Video and PDF

Video edition for Lavi: An Engineer's Perspective.

Original chart pack is available below:

Lavi - An Engineer's Perspective

The Lavi fighter program was the largest weapons development effort ever undertaken by the State of Israel - embodying a unique, Israeli perspective as to what elements were most essential in the design of a modern warplane.

The following summary provides a brief cross section of this development effort, with a focus on the technological, engineering side of the program - setting aside for the moment the historical chronology, as well as the political debates that also surrounded this aircraft. In developing this summary, I have drawn on my years of experience as an aerospace engineer, leveraging in particular the skills that I first learned as a teaching assistant for Aircraft Design more than two decades ago. It has been my experience that it is when you have to teach a subject to someone else, that you first truly master it, and it is on that experience that I have drawn heavily on here. Again, I point out that the opinions expressed here are my own, and do not necessarily represent those of my employers, either past or present.

As an aerospace engineer trained in the discipline of design, you come to see aircraft somewhat differently from the casual observer. The features that go into a design become recognizable as the products of conscious design trades, rather than the result of arbitrary selections or preferential aesthetics. In this manner, the Lavi bears a unique, and distinctively Israeli emphasis in its design and construction.

In order to appreciate many of the trades that went into the Lavi, however, it often helps to have a point of reference. To this end, there just so happens to be one particular aircraft that stands out as the natural point of comparison: the General Dynamics (later Lockheed Martin) F-16. The F-16, to which the Lavi was so often compared, provides a contemporary reference point that was, among other things, the most widely produced lightweight fighter of its day. It was also, however, designed with a slightly different focus to its development.

The F-16 was first developed during the 1970s as a lightweight air-to-air "day fighter", with a secondary air-to-ground capability. In this regard, the F-16 was following in the footsteps of such aircraft as the F-5E Tiger II, which set the standard during the Vietnam War era for what could be accomplished within a lightweight fighter configuration. Like the F-5E, the developers of the F-16A selected a thin, trapezoidal wing. While this fit in with the lightweight design concept behind the F-16, it also led to a wing configuration with limited volume available for fuel stowage - requiring the F-16 to carry the majority of the fuel that it needed to complete its mission inside its fuselage.

The Lavi, in contrast, had a very different emphasis. The Lavi was designed as an air-to-ground fighter-bomber first, with a secondary air-to-air mission. The antecedents for the Lavi design included such strike aircraft as the Kfir and the A-4 Skyhawk. Much like the A-4 Skyhawk before it, the Lavi selected a delta-wing configuration, with a thick wing root section. This configuration would prove crucial toward providing the fuel capacity necessary to complete the airplane's mission. Whereas the F-16 was able to reserve volume in its wing structure for only 19-percent of its total required fuel capacity, the Lavi was able to reserve space for roughly 54-percent of its internal fuel capacity within its wings - allowing crucial volume in its fuselage to be reserved for other needs.

The selection of a delta wing configuration for the Lavi had a variety of implications - above and beyond the available fuel volume. The spars that carry the span-wise load through the wing of an airplane are essentially tapered I-beams in their cross-section. As any freshman engineering student should know, the modulus of an I-beam will increase as the height of the I-beam cubed, and the bending stress of an I-beam will decrease as the height of the I-beam squared. The result was that due to its thicker wing root, the Lavi wing structure was inherently stronger, and could carry more weight than its counterparts.

It was this kind of structural trade that allowed the Lavi to achieve a maximum take-off weight that was 13-percent greater than a Block 30 F-16C, with an empty weight that was 10-percent less.  Or measured another way, which allowed the Lavi to achieve a hi-lo-hi combat radius that was 50-percent greater than a Block 40 F-16C, with an empty weight that was 20-percent less.

Added to the inherent structural advantage of the Lavi's thicker wing root section, was the incorporation of composite materials. The Lavi airframe was intended to be 22-percent composite materials by weight - compared to the roughly 2-percent of the airframe weight found on the F-16A. The incorporation of composites allowed such structures as the Lavi wing, vertical tail, canard, air brakes, and ventral strakes to be lighter. They also, however, reduced drag, and allowed for the incorporation of aeroelastic tailoring to further improve on performance.

The Lavi was intended, for example, to carry many of its weapons loads semi-conformally on under-fuselage hard points. When combined with aeroelastic tailoring to reduce stores-induced wing flutter, it was expected that aerodynamic drag could be reduced on the Lavi by up to 50-percent. This degree of refinement had simply not been available at the time that the F-16 was developed a decade before.

The selection of the Lavi wing arrangement, however, was only one of many design trades that went into the development of the airplane. Another example was provided by the Lavi's inlet arrangement. The developers of the Lavi evaluated multiple candidate inlet configurations, from the axisymmetric arrangement seen on the Kfir, to side-mounted inlets, to the ventral inlet that was eventually selected. Evaluated on the basis of inlet distortion at high angles of attack, both the side-mounted, "shielded pitot" style inlet, and the ventral inlet offered superior performance with lower inlet distortion. Eventually, however, the ventral inlet was down-selected for the Lavi by virtue of its lower structural weight.

Similarly, multiple configurations for the Lavi vertical tail were initially assessed. Among the more unusual was the tail-boom configuration, which offered superior directional stability at very high angles of attack. Once again, however, the Lavi developers down-selected to a more conventional, single vertical tail, due to its lighter weight.

Among the most central design choices made by the Lavi developers, was the selection of its canard-delta configuration. Canard fighter designs fall into two general categories: close-coupled, and long-coupled. Close-coupled canard designs place the canard in close proximity to, and slightly above the wing, to maximize the canard-wing interaction and increase the airplane's lift-to-drag ratio. This design approach includes such aircraft as the Kfir, Gripen, and Rafale - in addition to the Lavi. Long-coupled fighter designs, in contrast, attempt to leverage the high angle-of-attack control authority that the canard offers, while reducing the size and wetted area of the canard to its bare minimum. These designs, as represented by the Rockwell-MBB X-31A, or by the Eurofighter Typhoon, will tend to maximize the distance between the canard and the wing, and will position the canard at the same elevation, or perhaps slightly lower, than the wing.

Relative to its wing size, the Lavi had the largest canard of any fighter or fighter prototype yet developed. It was also positioned closer to its wing than most of its counterparts, resulting in a greater improvement in aerodynamic efficiency. This, in turn, further enhanced the Lavi's combat radius.

The other leading design decision that had to be made early in its development, was the airplane's engine selection - which was integral with the overall airplane sizing process. The Lavi fighter was originally sized around the F404 engine, at the time of the program launch in February 1980. As the requirements of the program expanded, however, it soon outgrew its original engine selection, and the design was relaunched in May of 1981 with the larger PW1120 engine. The PW1120 afforded a 28-percent increase in available engine thrust, which translated into a larger airframe, with up to a 19-percent increase in combat radius.

Despite its focus on the air-to-ground role, however, the Lavi still needed to be able to perform a secondary air-to-air function. A first order assessment for how the Lavi would have performed in this role can be obtained by comparing the thrust-to-weight ratio, and wing loading of the Lavi to similar values for its counterparts. In general, aircraft with higher thrust-to-weigh ratios will tend to offer superior acceleration, and aircraft with lower wing loadings will tend to offer superior, instantaneous turn rates. This comparison is valid for trends only, however, since it lacks any correction for differences in the aerodynamic performance of each design.

Compared in this fashion, it can be seen that the Lavi and the F-16A were developed with very different strategies in the air-to-air arena. Building on historical experience with such lightweight fighter designs as the F-5E, the F-16A sought to maximize its advantage in thrust-to-weight ratio over its peers of the day.  The Lavi, in contrast, still had to perform its primary mission as an air-to-ground platform. It could not therefore expect to meet or exceed the thrust-to-weight capability of aircraft such as the F-16, seeking instead to leverage its advantage in wing loading to attain a higher turn rate.

It can also be seen from this comparison that, as additional strike roles were added to the F-16, weight was also added in order to increase payload capability. Advances in engine technology allowed the F-16 to maintain its high thrust-to-weight ratio with each successive Block release, but its wing loading continued to climb - impacting turning performance.

A more complete story of relative aircraft performance can be achieved using an energy-maneuverability, or "E-M" diagram. The E-M diagram will portray isocontours of specific excess power, plotted against speed or Mach number on the horizontal axis, and either altitude or turn rate on the vertical axis. Regions where the specific excess power is positive, will denote zones where the airplane is able to accelerate or gain altitude. Regions where the specific excess power is negative, will denote zones where the airplane will lose either speed or altitude. The isocontour where specific excess power is zero, will identify the maximum sustained turn rate for the airplane at that particular speed, altitude, and weight combination. The E-M diagram also allows us to compare competing fighter designs, to evaluate regions of the flight envelope where each is at a relative advantage.

In the instance of both the Lavi and the F-16A, there is published data available from the open literature allowing us to develop an unofficial, approximate E-M diagram from which to make just such a comparison. As anticipated, the Lavi would be expected to achieve an advantage at elevated turn rates. The F-16A, in contrast, would be expected to achieve an advantage at lower turn rates - where it could out-accelerate the Lavi.

In summation therefore, it should be apparent that the design of the Lavi was biased from its inception towards the air-to-ground role - a factor that drove its design towards lighter-weight options that maximized the airplane's range and structural efficiency. This emphasis was very different from its contemporaries, most of which were biased towards short-range, air-to-air objectives. The influence of this emphasis can be clearly seen in the design of the Lavi, where it is stamped large onto its design configuration

Again, this has been but a brief overview of the technical side of the story surrounding the Lavi.  Additional information about this program and its history can be found in the recently published book, Lavi: The United States, Israel, and a Controversial Fighter Jet.


Bibliography

Golan, John. Lavi: The United States, Israel, and a Controversial Fighter Jet (Sterling, VA: Potomac, 2016).
Shmul, Menachem, Eli Erenthal, and Moshe Attar. “Lavi Flight Control System.” International Journal of Control. No. 1, 1994: 159-182.
Tsach, S., and A. Peled. “Evolution of the Lavi Fighter Aircraft,” in Proceedings of the 16th International Council of the Aeronautical Sciences (ICAS) (Jerusalem: Aug. 28 - Sept. 2, 1988): 827-841.

Sunday, November 1, 2015

Alternative Fighter Performance Metrics - Video and PDF

Video edition for Alternative Fighter Performance Metrics.

Original chart pack is available below:

Alternative Fighter Performance Metrics

In follow-up to my previous series of posts regarding Aircraft Performance, I will be focusing on some of the modern fighter performance metrics - which began to emerge in the latter 1980s - and which may be less familiar to many outside of the aircraft performance community.

An example E-M Diagram, comparing between the F-4 and A-4.
To recap, in the early years of jet aviation, the majority of fighter performance measures used to evaluate designs were single design-point metrics.  Things like maximum speed, or time-to-altitude measures.  This changed during the 1960s with the emergence of Energy-Maneuverability Theory.  E-M diagrams, plotting isocontours of specific excess power against the speed and turn rate of each aircraft, allowed for the entire flight envelope to be graphically portrayed, and compared.  This was part of a revolution in how jet fighters were evaluated and designed.

In the latter 1980s, however, a new generation of computers made possible a new breed of fighter agility and performance measures - measures which combined different elements of the airplane's flight characteristics into a single metric.  Measures such as Combat Cycle Time (CCT), Dynamic Speed Turn (DST) plots, and Relative Energy State (RES) emerged as alternative figures of merit - and, according to their proponents, superior figures of merit.

Some insight into what these new measures bring to the table can be gleaned by examining the calculation of one such metric: Combat Cycle Time (CCT).  Combat Cycle Time was first proposed in 1988 by B.F. Timrat.  CCT represents the time that it takes for an aircraft to perform a turn (usually 180-degrees), and recover the energy lost in making that turn.  This can be subdivided into steps as follows:
Optimum trajectory analysis can reduce CCT by over 20-percent.
Early CCT studies assumed, erroneously, that each aircraft being analyzed would exercise the full limits of its "doghouse plot".  In practice, however, the minimum time to turn and recover energy is often found at somewhat lower turn rates that more effectively conserve energy.  An optimum trajectory analysis is therefore needed to draw a true comparison between different designs.

An example of one such comparison is provided in a study undertaken by Ryan and Downing (1995).  This study compared the performance of the F/A-18, X-29 and X-31 in a simulated 180-degree turn.  The starting conditions were fixed to Mach 0.8 and 15,000 ft altitude for each aircraft, and each aircraft was restricted to no more than a 2,500 ft change in altitude.  To make the comparison more consistent, each aircraft was restricted to a maximum 7g load factor, and optimum trajectory analysis was applied to ensure that each aircraft achieved a minimum CCT.
Comparing between the three aircraft, the shortest CCT was achieved by the F/A-18, the airplane which also had the highest instantaneous turn rate.  The next shortest CCT, however, was achieved by the X-31, the airplane with the lowest instantaneous turn rate.  What this implies is that CCT, like many of the other modern performance measures, represents a combined maneuver metric, incorporating elements of both turn rate and acceleration which could not be directly portrayed by any of the more simple, legacy metrics.

Despite the obvious utility of such metric, the modern maneuver metrics have not superseded their more simple predecessors.  A large part of this is due to the complexity and computational cost of these metrics.  Whereas single design point evaluations of time-to-altitude or maximum turn rates are relatively straightforward and inexpensive to calculate, the modern fighter agility metrics require a far more complex computational model that simulates the transient behavior of the aircraft across a range of possible maneuver and loading conditions.
Modern agility metrics provide therefore provide insight into the combined effect of the components that go into a maneuver, but do so at an added computational cost.  These metrics are also restricted to individual evaluations against a single maneuver, assuming that each individual pilot would choose to perform the same equivalent maneuver even when flying different aircraft.  This is in contrast to E-M Diagrams, which plot the excess energy of each aircraft but make assumptions regarding how each pilot would choose to utilize that energy.  The modern fighter agility metrics therefore compliment, but not replace, traditional performance measures

In summation, the underlying utility of each performance metric – relative to its computational cost – is a subjective measure.  More detailed metrics will require more complex and accurate computational models to calculate.  Single design-point metrics are still among the easiest to calculate – and still provide an inexpensive first insight into aircraft performance.  E-M Diagrams still provide a comprehensive view of performance – across the entire flight envelope – without pre-supposing what form of maneuver each pilot or each aircraft might undertake.  They will therefore continue to be an invaluable tool for many years to come.  More modern agility metrics offer additional insight into the combined effects of different maneuver components, but require significantly more computational investment to undertake.  And in the end, fully featured, piloted simulations will remain the gold-standard for assessing the merits of new technologies and alternative designs.  They will continue to offer the most complete assessment tool available, short of building and flying each individual aircraft.

Thursday, August 20, 2015

Aircraft Performance - Part 5 - Video and PDF

Video edition for Part 5 of the Aircraft Performance Review.

Original chart pack is available below:

Aircraft Performance - Part 5 - Example Calculations

Completing either a performance calculation or mission analysis requires three essential ingredients:
  • Basic statistics on the airplane's size and configuration
  • Engine thrust and fuel performance throughout the flight envelope (including max, military and part power conditions)
  • The airplane's drag polar, including the effects of stores drag, Mach number, and g-loads

A central element of this simulation will be the predicted engine performance.  For many of the jet engines now flying, performance information is readily published at static, sea level conditions.  Such statistics as maximum and military (or dry) thrust, specific fuel consumption, overall pressure ratio, fan pressure ratio, bypass ratio, and air flow are all published for many of the engines developed during the 1980s and in the decades before.  These statistics provide a basis for extrapolating engine performance across to other design conditions.  Again, the objective here is not to precisely simulate everything that goes on inside of a modern jet engine, or to design its components.  We are not seeking that level of detail.  Moreover, any functional limitations - such as maximum pressure limits - will be unknown.  But such an extrapolation will allow an engineer to draw some conclusions regarding how the engine, and aircraft, will perform across a broad variety of flight conditions.

There are two software packages currently available to the general public that would allow us to perform precisely this sort of extrapolation: AEDsys, produced by the American Institute of Aeronautics and Astronautics (AIAA) as a teaching tool; and GasTurb, produced by a retired engineer from MTU Germany.  The GasTurb software offers a more comprehensive tool set, but is also more difficult to use.  For the limited objectives of the example calculations portrayed here, AEDsys will be used.

The F100-PW-220 engine can be used as an excellent first benchmark.  This is the engine that today powers many of the older F-16 models, and most of the world's F-15 aircraft.  Many of the basic operating parameters for this engine are readily available from the open literature for sea level static (SLS) conditions.  This includes the overall pressure ratio, fan pressure ratio, bypass ratio, air flow, specific fuel consumption, even the burner exit temperature.  The only major parameters for which estimates would need to be made would be the component efficiencies, the afterburner temperature, and turbine cooling air and leakages.  Employing these basic parameters, its possible to generate an engine simulation for the off-design performance of this engine.

To assess the quality of this model, a comparison can be drawn against publicly available data for the F100-220 available from NASA publications.  Comparing the predicted and published thrust lapse (thrust at off-design conditions divided by the sea level static thrust), we can see that the analytical simulation provides a fair estimate for the performance of the engine across a wide range of Mach numbers and altitude.

Building on this successful experience, we can assemble a similar simulation for the F110-GE-100 engine, which equips the Block 40 F-16C.  Like the F100, statistics are publicly available for overall pressure ratio, fan pressure ratio, bypass ratio, air flow, and specific fuel consumption.  Unlike the F100, there is no publicly referenced value for the burner exit temperature - but we know that the F110 was a contemporary of the F100, employing similar technologies, and that the burner temperatures must be of similar magnitude.  There is therefore sufficient detail to develop an analytic model for this engine.

Similarly, basic statistics and configuration data - including airframe and fuel weights - are readily available for the the Block 40 F-16C.

Ordinarily, an outside analyst would need to make projections from the published airframe data to estimate the zero-lift drag coefficient and Oswald's efficiency.  Not a difficult task, but one which would add uncertainty.  However, in this particular example a significant amount of the data necessary for projecting the drag polar of the F-16 has also been published under various NASA reports - so airframe-calibrated data is already available.

Combining this collection of airframe statistics, projected engine performance, and drag polar data, we can  begin to perform an example mission profile assessment - in this instance for a hi-lo-hi mission.  Comparing between the published and predicted combat radius of the aircraft, we can see that the two values are in close agreement - with a predicted value of 770 nm compared to 760 nm from the published literature.  This comparison further affirms that with sufficient aircraft and engine data, and some fundamental design relations, we can draw some fairly accurate projections for the mission capabilities of a particular aircraft.

This assessment however, only touches on the mission profile capabilities of the airplane.  To complete the complementary performance assessments for this aircraft, we would need to be able to assess the effects of flight conditions on the drag polar of the aircraft.  This includes Mach number effects (for which published data does exist), and g-load effects.  The latter data is more difficult to come by, since it is not an area of particular concern for commercial aircraft.  There is, however, at least one published resource - again coming from NASA - that documents the effects of g-loading on the drag polars of the F-15, F-16 and F/A-18, allowing us to calibrate prediction methods for these effects.

In summation, there is a broad body of published data for both aircraft and engine operation, available for many of the aicraft flying today.  Even many Soviet aircraft, once shrouded in secrecy, have come into public view with the fall of the Berlin Wall - drive by the Russian manufacturers as they seek to secure export sales.  Significantly, this same data is not readily available for some of the most recent aircraft flying today.  Many of the basic statistics for both the airframe and engine of the F-22 and F-35 remain unpublished, to prevent a potential adversary from performing precisely the type of analytic studies that are illustrated here.

Monday, August 10, 2015

Aircraft Performance - Part 4 - Video and PDF

Video edition for Part 4 of the Aircraft Performance Review.

Original chart pack is available below:

Aircraft Performance - Part 4 - Energy Maneuverability

Energy-Maneuverability theory arose during the latter 1960s as a means to evaluate air combat capabilities in a more holistic sense.  Prior to this, fighter jet requirements had been specified on the basis of a few discrete performance parameters - parameters which often had little to do with the success or failure of an aircraft in a combat setting.  Criteria such as maximum speed, maximum altitude, or time to altitude were not uncommon.

Energy-Maneuverability was the brainchild of then Major John Boyd (USAF) and Thomas P. Christie, a mathematician and civilian consultant to the Air Force.  E-M theory provided a means to portray aircraft capability - and even relative capability comparing two different designs - by utilizing isoplots of specific excess power, plotted on a graph portraying speed or Mach number on the one hand, and turn rate on the other.

In a typical E-M diagram, we will see the airplane's speed or Mach number plotted on the horizontal axis, and the turn rate plotted on the vertical axis.  Within this plot, will be portrayed the maneuver envelope for the airplane.  The left-hand bound will typically designate the lift-limit of the aircraft - as defined by its stall characteristics.  The upper bound will designate the airplane's maximum load factor or g-limit.  And the right-hand bound will be defined by a dynamic pressure limit that usually designates either an airframe limitation, or an engine limitation.  Where the lift limit and the g-limit converge, will be the airplane's maximum instantaneous turn rate.  Note that the speed or Mach number where this occurs will be identified as the "corner speed" of the aircraft.
Within this envelope will be plotted a series of isocontours for specific excess power.  This is the amount of energy that the airplane has available to either accelerate or climb.  The contour where specific excess power equals zero will define the maximum sustained turn rate for the aircraft.  This is a contour - not a single value.  It will change depending on altitude and Mach number.  Above this maximum sustained turn rate, specific excess power will be negative - meaning that the airplane will loose either speed or altitude when it flies in this regime.  Below this line, specific excess power will be positive - meaning that the airplane can accelerate or climb.

If we combine the E-M diagrams for different aircraft, we can draw a direct comparison for how each aircraft would fare in a dissimilar air combat exercise.  The example shown here is from published sources, comparing between the F-4J Phantom and the A-4M Skyhawk.  Note that at the top of the diagram, it describes the fuel, payload and weight of each aircraft, as well as the altitude at which this comparison was made.  We can see that the limit load factor or g-limit for each aircraft is very similar.  As expected, however, the F-4 has a higher maximum speed.  Conversely, we can see that the lift-limit, or stall speed for the A-4 is significantly lower than for the F-4.

The zero-specific excess power isocontour identifies the maximum sustained turn envelope for each aircraft.  If we draw a line connecting the equivalent isocontours for the two aircraft, we can begin to understand where the pilot of aircraft would prefer to engage his opponent.  The A-4 pilot will seek to draw his opponent into a low-speed turning engagement, where his aircraft will have the upper hand.  The Phantom pilot, on the other hand, would be advised to retain his speed advantage and to engage his opponent on the lower right side of the envelope, where he will have a specific excess power advantage.

There are of course a number of other factors which can effect the outcome of an engagement.  Control authority is one such example.  During the Korean War, on paper, the MiG-15 should have had a clear advantage in a turning engagement over its U.S. F-86 Sabre counterpart.  However, the MiG of that day was still employing a mechanical control system featuring push-rods and pulleys, whereas the F-86 was the first fighter to employ a hydraulically boosted control system.  This meant that the MiG pilot had to exert tremendous force at higher g-loadings to control his aircraft.  This was further exacerbated by the excessive flexibility of the MiG wing structure, which could lead to aileron reversal at high g-loading - resulting in loss of control.  Other examples of the central role of control authority can be seen in the decision to increase the size of the tail surface between the YF-16 and later F-16 production aircraft.  A similar phenomena occurred between the YF-22 and the F-22 production fighter.

Weapons systems can also play an important role in the outcome of an engagement.  During the Falklands War in 1982, the British armed forces were at a distinct advantage in part due to the all-aspect heat-seeking missiles at their disposal.  The Argentine Air Force, in contrast, had to rely on older generation missiles that required the pilot to maneuver before he could fire the missile, so that it could home in on the hot exhaust of his opponent's engine.  Similarly, the advent of high-off-boresight heat seeking missiles, in combination with a helmet mounted sight, potentially placed U.S. aircraft at a distinct disadvantage vis-a-vis their Soviet counterparts during visual range engagements by the latter 1980s.  This "missile gap" was only recognized after the fall of the Berlin Wall, when U.S. aircraft had the opportunity to interact with former East German Luftwaffe fighters.  The advantage that this technology provided to the East German MiG-29s was overwhelming - leading the United States to develop the AIM-9X together with a helmet-mounted sight produced to close capability gap.

And of course, modern sensors have similarly altered the conduct of war, with the introduction of AWACS being the most noteworthy example of this impact.

Nonetheless, pilot training remains essential, even today.  Despite all of the electronic wizardry, the pilot remains the chief tactician behind any aerial engagement.  It is up to the pilot to select the strategy that will place the enemy within the lethal envelope of his own weapons, without unduly exposing himself to his adversary's weapons.  This is a role that no machine can substitute for.

Finally, there will be some that will question whether energy maneuverability, and maneuverability in general, are still relevant in an age of beyond visual range (BVR) missiles.  As demonstrated in actual air combat experience, however, the majority of air-to-air engagements - even in a missile age - will still occur within visual range.

A study commissioned by the U.S. Air Force in 1986, combining data on all known U.S. and foreign missile kills, found that only four kills could actually be ascribed to BVR missiles fired from beyond visual range.  That's 4 out of 407 successful missile kills.  Even those kills made by radar-guided, BVR missiles it turned out, were predominantly made within visual range.

In the decades since, sensor technology has continued to advance.  During the 1991 Gulf War, 16 out of 38 allied kills were made from beyond visual range.  However, this still means that the majority of air-to-air kills, 58% to be precise, occurred within visual range.  Similarly, in the post-Gulf War era, only 3 out of 11 successful kills by U.S. aircraft were made from beyond visual range.

Typical BVR engagement profile (Herbst 1983)
Studies into the dynamics of air combat have also affirmed that even in BVR engagements, "careful power management" is essential to maximizing a fighter's kill-to-loss ratio.  Maintaining an energy advantage therefore remains as essential today as it was when E-M theory was first developed in the 1960s.

Monday, August 3, 2015

Aircraft Performance - Part 3 - Video and PDF

Video edition for Part 3 of the Aircraft Performance Review.

Original chart pack is available below:

Aircraft Performance - Part 3 - Turn Rate and Acceleration

Aircraft performance encompasses a wide range of metrics.  Everything from take-off distance, to stall speed, to cruise speed, are all measures of performance frequently invoked in the aircraft design process.  Most of these measures are universal to both civil and military aircraft.  There are two classes of performance metrics, however, which tend to be the central focus of attention for most military, high performance aircraft today: acceleration (also measured in terms of climb rate or time to altitude), and turn rate.

Once an airplane's drag polar is in hand, and in combination with a few, basic aircraft parameters, there are a wide range of aircraft performance calculations which become possible.  For example, we could consider the relationship for an airplane's maximum sustained load factor, or g-load.
We can see from this relationship that the sustained load factor is related directly to the airplane's thrust-to-weight ratio, and is inversely related to its wing loading.  In other words, increased thrust-to-weight leads to an increase in the sustained load factor, while a decrease in wing loading likewise leads to a decrease in the sustained load factor.

There is also a dependency on the angle of attack in this relationship.  Note that for a small angle of attack, that the cosine value will tend to approach unity, and the sine value will approach zero.  For many civilian aircraft applications, this approximation will be invoked.

Also visible in this relationship is a dependency on the zero-lift drag coefficient.  However, the zero-lift drag coefficient is divided in this relationship by the wing loading squared.  The airplane's sustained load factor will therefore be only weakly influenced by the drag coefficient, but will be heavily influenced by the thrust-to-weight ratio or wing loading.

The airplane's aspect ratio and aerodynamic, or Oswald's efficiency will also play a role in the calculation of the sustained load factor - sharing equal weight with both the thrust-to-weight ratio and the wing loading.

Once the load factor has been calculated, the associated turn rate rate can be directly determined, and will be directly proportional to the load factor.

We will find that these same aircraft parameters will appear over and over again in different performance calculations.  What will differ will be the relative weight and influence that each parameter will have in the outcome of the calculation.  Consider for example the maximum instantaneous load factor.
The maximum instantaneous load factor will be directly related to the airplane's maximum lift coefficient.  It will also be inversely proportional to the airplane's wing loading, much like the maximum sustained load factor.  Unlike the sustained load factor, however, the one thrust-to-weight ratio term appears only in connection with the sine of the angle of attack.  The result is that while the sustained load factor will be equally sensitive to both the thrust-to-weight ratio and the wing loading, the instantaneous load factor will be primarily a function of the wing loading.

If we turn to the calculation of specific excess power, on the other hand, we will see that - like most measures of acceleration - specific excess power will be primarily a function of the thrust-to-weight ratio.
There is a g-load sensitiity to specific excess power.  Increasing load factor will result in less available excess power for acceleration or climb.  And there is a lift-to-drag dependency which has embedded into it the wing loading and aerodynamic perormance parameters.  At low load factors, however, specific excess power will be primarily a function of thrust-to-weight ratio.

If we rearrange the relationship for specific excess power in terms of the load factor, we gain a relationship that will relate the load factor (and the turn rate) to the available specific excess power state.  This relationship is crucial to calculting the energy state throughout an airplane's flight envelope, as will be discussed in a later segment.

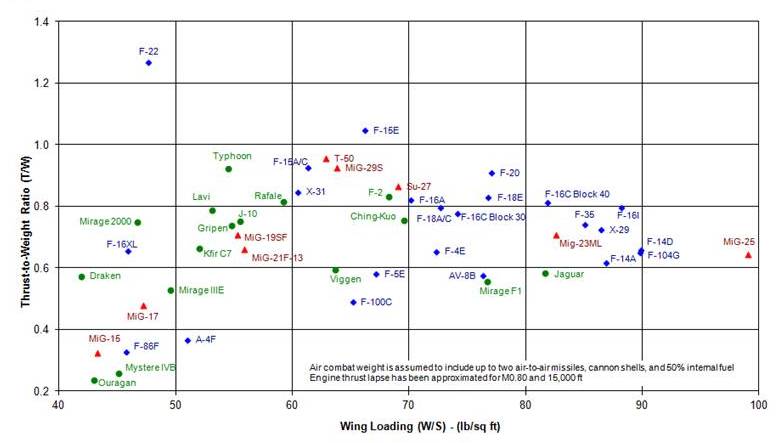
For the purposes of many high-level, first-order comparisons between different aircraft designs, it is common to draw a comparison on the basis of wing loading, and thrust-to-weight ratio, in a manner reminiscent of the constraint diagram described earlier.  This sort of plot is useful of describing basic trends.

In general, lower wing loadings will result in superior instantaneous turn rates.  Similarly, higher thrust-to-weight ratios will result in superior acceleration.  While useful for first-order comparisons, it should also be kept in mind that what is missing from this simplified comparison, is the effect of aerodynamic efficiency, which has been omitted from this type of plot.

If we draw a plot such as this for a number of fighter aircraft, we can begin to draw some basic comparisons for global trends.  In order to keep this comparison grounded, all of the aircraft have been assessed with a similar fuel state and weapons load - with fifty percent of internal fuel and up to two air-to-air missiles.  A rough adjustment has also been made to the thrust-to-weight ratio to account for the effects of thrust lapse at speed and altitude.

In this comparison, we can see a number of historical match-ups, such as between the MiG-15 and F-86 Sabre of the Korean War era.  Obviously, the MiG had considerable, theoretical advantage over the F-86 in a classic, turning engagement.  In practice, however, as many of us are aware, the Sabre crews had a number of advantages in their favor: foremost of which was their higher level of training, but also in terms of their control system - which will be discussed in a later segment.

We can also see in this plot a comparison between the MiG-21 and F-4 Phantom of the Vietnam War era, reaffirming what many of us were already aware of, in terms of the advantages of the MiG in a turning engagement.

Also from this plot, we can see how a particular aircraft model might evolve over the course of its lifetime.  Consider for example the evolution of the F-16 from its F-16A Block 10 origins, to the F-16C Block 30, and later the Block 40, and eventually the Block 52+ F-16I.  As more range and more payload was demanded of the airframe, weight was added.  In this instance, additional thrust was also added throughout the life of the program, but the addition of this thrust could not alter the increase in wing loading that came with each successive generation.  The one exception to reverse this trend was Japan's F-2 derivative from the F-16, which added additional wing area to achieve a wing loading similar to the early F-16A despite its greater weight and payload capacity.

Another match-up that we can witness from a comparison such as this comes from the Eurofighter Typhoon.  When the Typhoon was under development, a series of studies were published in Europe evaluating just how much thrust-to-weight ratio the European partners could afford in practice, and still be able to produce enough aircraft to be meaningful.  The Typhoon was the product of those studies.  On the other side of the Atlantic, however, the United States, with much deeper pockets, produced the F-22 Raptor, which far exceeded the thrust-to-weight limits that had been set on the Typhoon due to economic realities.  Both the Typhoon and the Raptor were heavily biased towards the air-to-air role, and both are excellent platforms in their intended role.  In this example, however, the power of economics can be clearly seen.

While useful for initial comparisons, it should not be forgotten, however, that a third component - the aerodynamic component - is nonetheless missing from these basic comparisons.

Monday, July 27, 2015

Aircraft Performance - Part 2 - Video and PDF

Video edition for Part 2 of the Aircraft Performance Review.

Original chart pack is available below.

Aircraft Peformance - Part 2 - Basic Calculations

In Part 2 of this series on aircraft performance, we will be discussing some of the basic calculations that go into aircraft performance evaluations, with an eye towards gaining a basic appreciation for the mathematics involved.

The cornerstone of any performance or mission analysis calculation, will be the airplane's drag polar.  For the purposes of this presentation, we will be looking at a classical drag polar representation.  There are modified versions of the drag polar in use, but for our purposes, the classical representation should serve just fine.
The drag polar relates the airplane's total drag to a combination of the zero-lift, or parasitic drag, and the induced drag - or the drag due to lift.  The induced drag, in turn, can be related to the lift coefficient squared, divided by the airplane's aspect ratio and the aerodynamic efficiency, or Oswald's efficiency.  It should be noted as well that the aspect ratio is itself related to the airplane's wing span squared, divided by the wing reference area.

In order to be effective, the drag polar needs to take into account a variety of real world effects.  The first element to note is that the wing reference area is itself a somewhat arbitrary quantity.  It's what we would get if we were to extend the wing leading edge, and the wing trailing edge all the way to the airplane's centerline.  What this means in practice is that the aerodynamic efficiency must be adjusted to take into account such real world effects as the wing cross section, wing-to-fuselage integration, whether the design has a canard or a horizontal tail, and so forth.

Similarly, the parasitic drag will be a function of the airplane's wetted area, the coefficient of friction (book keeping the effects of rivets and similar protrusions), and the Mach number.  Particularly in transonic and supersonic flight, the parasitic drag can be expected to rise significantly due to wave drag.

Finally, in addition to being affected by fuselage integration, wing cross section, and similar effects, the aerodynamic efficiency will also be a function of the airplane's Mach number, and aerodynamic loading (or g-loading).

The mission analysis in turn is calculated by breaking the mission down into small segments, which can then be analyzed for fuel burn.  Effectively, the airplane is analytically "flown" through the mission.  In its most simple form this principal can be expressed by the Breguet range equation - which also provides insight into what these equations can tell us.
The Breguet range equation relates the range of an airplane to its initial weight, at the beginning of the flight, and its final weight, at the end of the flight - in a logarithmic manner.  In other words, the relationship will be highly nonlinear.  Range is also affected in direct proportion to the cruise velocity, as well as the lift-to-drag ratio, and is inversely proportional to the thrust specific fuel consumption (TSFC).  The Breguet range equation, however, is also accurate only if the velocity, fuel consumption, and lift-to-drag ratio remain constant.  It should also be pointed out that the lift-to-drag ratio is itself an output of the drag polar.
More detailed mission analyses will break a mission down into a series of segments, each small enough that variations in speed, altitude and specific fuel consumption become negligible across that particular segment.  As an example, an equation for a constant altitude and speed cruise segment is portrayed here.  For a complete mission, each segment of flight would need to be evaluated separately, with longer segments - such as cruise - further subdivided.

Part of the real beauty of the relationships described here, is that they allow us to draw comparisons and conclusions from different design trades without necessarily exercising a detailed mission calculation.  Consider for example the Boeing 777X currently under development as a more fuel efficient, longer range development of the original 777 design.  The 777X is expected to increase the wingspan of the airplane from the 212-ft 7-in found on the 777-200LR, to 235-ft 6-in for the 777-8X - a 10.8% increase.

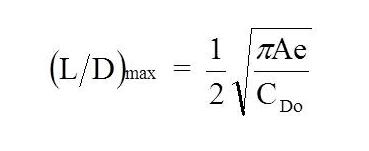
From the drag polar, the maximum lift-to-drag can be calculated from the relationship shown below.  Note that the lift-to-drag ratio is related to the square root of the wing aspect ratio, which in turn is related to the wingspan squared.  Assuming a constant wing area, therefore, we would conclude that the 777X should offer a 10.8% increase in range over existing 777 models - just by virtue of the increased aspect ratio alone.
This of course, might lead us to wonder why Boeing did not take advantage of an extended aspect ratio design much earlier.  The answer to this lies in the structural limitation for an all-metal wing.  The existing 777 design represents the practical limit for airline aspect ratio for an all-metal structure.  What makes the higher wing span and aspect ratio of the 777X possible is the introduction of a composite structure.

Again, a great deal of insight can be gained just by virtue of examining the underlying relations for range and the drag polar.

Monday, July 20, 2015

Aircraft Performance - Part 1 - Video and PDF

Video edition of Part 1 of the Aircraft Performance Review.


Original chart pack is available below.

Aircraft Performance - Part 1: The Design Crossroads

The following is the first in a five-part series tracing how aircraft performance is calculated, and its relationship to the mission requirements for the aircraft.  This combination of metrics for performance and mission requirements go hand-in-hand throughout the early phases of the airplane design process.
Performance encompasses a broad series of design requirements, from take-off and landing distances, to cruise and maximum speeds, to turn rate and acceleration.  All of these metrics describe how an airplane will fly.

The mission requirements, on the other hand, define how far the airplane is expected to fly, and with what payload.  Both a 737 and a 747, for example, might have many performance metrics that are similar, from take-off distance to cruise speed.  Their range and payload requirements, however, are radically different.  Where these two sets of requirements meet - both the performance metrics and the mission requirements - will define how large the airplane will need to be.


Early in the airplane design process, during conceptual and even into preliminary design, the airplane's performance requirements will typically be portrayed in the form of a constraint diagram.  This diagram will plot the thrust loading, or thrust-to-weight ratio on the vertical axis, and the airplane's wing loading or the weight divided by the wing area on the horizontal axis.  On this diagram - for a given airplane configuration - the developer will plot lines that define the thrust loading and wing loading combinations that meet the minimum performance objectives laid out for that aircraft.  Collectively, these lines will identify the boundary for the solution space, defining all possible thrust loading and wing loading combinations that meet all of these performance objectives.

Within this solution space, the developer will typically down-select to the configuration with the minimum thrust-to-weight ratio, and the highest wing loading (minimum wing area) that satisfies all of the design criteria.  This is because the customer will seldom pay extra for additional performance that they did not require.  A larger engine or a larger wing would require additional raw materials to produce, driving up the unit cost with no appreciable increase in what the customer is willing to pay.  Moreover, if forced to choose between an airplane with a higher thrust-to-weight ratio (larger engine), and one with a lower wing loading (larger wing), the developer will usually gravitate towards the solution with the larger wing.  Pound-per-pound, adding wing area will be far less expensive than adding a larger engine.

Finally, the resulting design combination - the airplane's configuration, thrust-to-weight ratio, and wing loading - will be exercised in a simulated mission analysis to determine the size of the resulting aircraft.  As we will see in the following segments in coming weeks, this design effort will be an iterative process.